

It’s a sentiment that Nina Heyden, FCRH ’17, holds dear. Currently on a Fulbright fellowship at the University of Essex in the United Kingdom, she’s pursuing a Master of Science in Applied Economics and Data Analysis. She’s taking complex information, often big data, and boiling it down into digestible graphics, charts, and other discernible ways that visually convey what the numbers mean.
At Fordham, Heyden studied math and economics, where she got a foundation in econometrics and data analysis for work that she is continuing to do at Essex. Throughout her schooling, she said, she has set out to demystify complex economic concepts through visualization. As an undergraduate, she created interactive graphics to showcase the data behind the plight of the world’s migrant population.
“I am interested in social science research because it can influence policy and can affect the lives of a great number of people,” she said. “A visualization component is very important to explain trends to the general public and to policymakers in a clear and concise way. That’s why I find data visualization so compelling.”
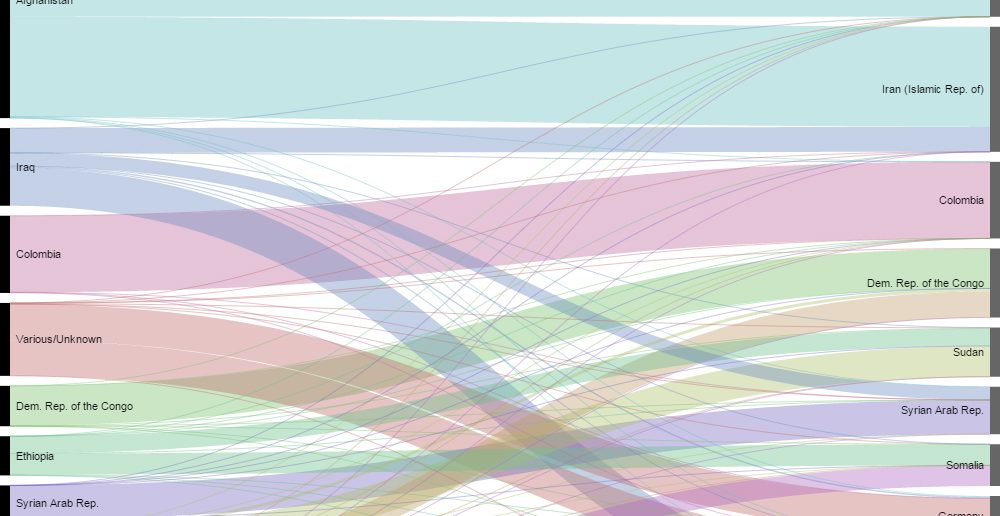
An alluvial (flow) diagram created by Heyden, captures migration volume from countries of origin to countries of asylum.
Heyden said she learned about merging social justice with her academic strengths through Fordham’s Urban Plunge and the Dorothy Day Center for Service and Justice programs. She was also influenced aesthetically by her father, an architect, and her grandmother, a tapestry weaver.
“It concerns me to hear the statements that people make misinterpreting data on immigration, or not understanding the facts,” she said. “One thing that comes to mind is that there’s a lot of data that show that immigration can benefit a nation’s economy.”
Heyden began her examination of refugee and migrant populations by using data from the United Nations. At the University of Essex, she has access to the UK Data Archive, which holds one of the world’s largest collections of social and economic data. The longitudinal data, in particular, enables her to analyze trends using the same variables across time, “and often over several decades,” she said.
In the United Kingdom, as in the United States, anti-immigrant sentiment contributed to the nation’s election outcome of 2016. A study published in the British Journal of Social Psychology found that anti-immigrant prejudice played a major role in support for Brexit. To provide evidence to the Migration Advisory Committee, Heyden will be joining several economists in London to investigate how immigration impacts the U.K. economy, she said. The data will help inform policy within the context of Brexit.
Among the questions the group will be asking are: How does immigration impact productivity? And, does an increase in low-skilled workers encourage native workers to seek training and move into less physical, more communication- or cognitive-intensive occupations?
“Consensus from economic literature is that immigration is a net benefit to developed countries such as the United Kingdom and the United States,” she said. “In short, immigrants increase labor supply in addition to labor demand, and the U.K. labor market is flexible, adjusting quickly to shocks. Beyond integrating into the labor market, immigrants help to reduce the U.K. budget deficit by contributing more in taxes than they use in welfare and benefits.”
She reiterates that the truth is in the numbers.
“I’m interested in statistics because it can provide concrete answers to these problems that seem overwhelming,” she said. “And that brings me back to data visualization, because you can see the data clearly for yourself.”


